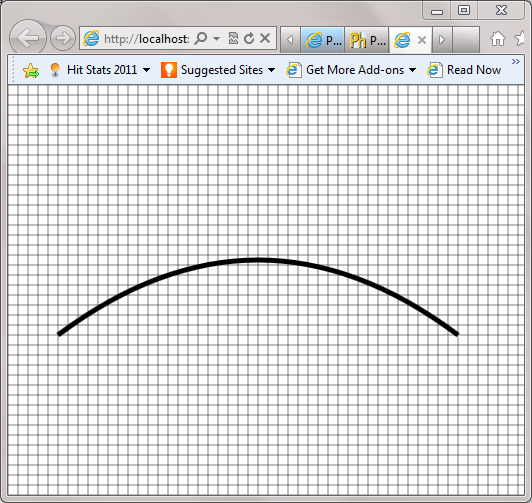
I’m in the process of finalizing my preparations for tomorrow’s HTML5 Game Camp in New York City, and figured I’d share one of the functions I put together to help in the process of visualizing some of the different ways you can draw and manipulate objects on an HTML5 Canvas object. It’s a simple function called renderGrid, which takes as arguments the ID of the canvas you want to draw on, the pixel interval for the gridlines, and the color of the lines, and draws out a grid just like you’d see on graph paper. Call this function before you start drawing objects on your canvas, and you’ll have a nice reference grid to help you more easily visualize the layout. You can customize it to your liking by tweaking the pixel interval, and it’s relatively unobtrusive in your code.
Here’s what it looks like, with a Bezier curve drawn with the function, context.quadraticCurveTo(250, 100, 450, 250);, with a grid pixel interval of 10:
And here’s a fiddle with the code:
Keep in mind that the more lines you draw, and the higher your target frame rate, the bigger the impact on your performance. You might consider drawing to a second canvas element behind the first, with less frequent updates, to mitigate this.
Hope you find it useful!
Comments
Comment by Snelldl on 2012-02-15 06:13:00 +0000
Dude: came across your code, exactly what I needed. Thanks!
Comment by devhammer on 2012-02-15 11:34:00 +0000
You’re very welcome. Glad you found it useful!
Comment by chris on 2012-05-01 07:35:00 +0000
thanks for this, was overlaying an image with a grid recently;
so had something simliar; I did find that to have pin sharp lines you need to start the position (iterator) at either -0.5 , or 0.5
// horizontal grid lines for(var i = -0.5; i <= canvas.height; i = i + gridPixelSize) { context.beginPath(); context.moveTo(0, i); context.lineTo(canvas.width, i); context.closePath(); context.stroke(); } // vertical grid lines for(var j = -0.5; j <= canvas.width; j = j + gridPixelSize) { context.beginPath(); context.moveTo(j, 0); context.lineTo(j, canvas.height); context.closePath(); context.stroke(); }
Comment by devhammer on 2012-05-02 07:23:00 +0000
@0ea769498c5c9b082eb36307d8f59d99:disqus Thanks for the suggestion…I will have to give that a try when I have some spare time.
Comment by Zulema Ortiz on 2012-08-23 17:06:00 +0000
Very useful, thanks!
Comment by devhammer on 2012-08-23 17:51:00 +0000
Glad you enjoyed it! Thanks for stopping by.
Comment by Rok Fajfar on 2012-12-29 17:27:00 +0000
Thanks!
Comment by Mr Jack on 2013-07-25 15:24:00 +0000
problem is that they stay on save.
Comment by devhammer on 2013-07-25 21:22:00 +0000
Not sure I’m following…can you elaborate?
Comment by Mr Jack on 2013-08-08 02:13:00 +0000
The grid becomes part of the canvas image, which when saved in a jpg is still visible.
Comment by devhammer on 2013-08-08 10:38:00 +0000
Right. That’s the behavior you’d expect. If you want to save the output of the canvas to a bitmap, and don’t want the grid, you could just add another iteration of the rendering loop and omit the code that renders the grid, then save the bitmap. Make sense?
Comment by God like Features #Mixed Squad on 2014-06-01 19:34:00 +0000
$(document).ready(function () {
var canvas = $(“#myCanvas”).get(0);
var context = canvas.getContext(“2d”);
function renderGrid(gridPixelSize, color)
{
context.save();
context.lineWidth = 0.5;
context.strokeStyle = color;
// horizontal grid lines
for(var i = 0; i <= canvas.height; i = i + gridPixelSize)
{
context.beginPath();
context.moveTo(0, i);
context.lineTo(canvas.width, i);
context.closePath();
context.stroke();
}
// vertical grid lines
for(var j = 0; j <= canvas.width; j = j + gridPixelSize)
{
context.beginPath();
context.moveTo(j, 0);
context.lineTo(j, canvas.height);
context.closePath();
context.stroke();
}
context.restore();
}
renderGrid(10, “red”);
});
Comment by God like Features #Mixed Squad on 2014-06-01 19:34:00 +0000
$(document).ready(function () {
var canvas = $(“#myCanvas”).get(0);
var context = canvas.getContext(“2d”);
function renderGrid(gridPixelSize, color)
{
context.save();
context.lineWidth = 1;
context.strokeStyle = color;
// horizontal grid lines
for(var i = 0; i <= canvas.height; i = i + gridPixelSize)
{
context.beginPath();
context.moveTo(0, i);
context.lineTo(canvas.width, i);
context.closePath();
context.stroke();
}
// vertical grid lines
for(var j = 0; j <= canvas.width; j = j + gridPixelSize)
{
context.beginPath();
context.moveTo(j, 0);
context.lineTo(j, canvas.height);
context.closePath();
context.stroke();
}
context.restore();
}
renderGrid(10, “red”);
});
Comment by Lukáš Unzeitig on 2016-04-19 06:38:58 +0000
Hi, how i can acces to individualy square in this grid? i wanna color them one by one. I do something like a graph.
Comment by G. Andrew on 2016-04-19 09:18:53 +0000
In order to color the individual squares, you’d need to calculate the position of each square you want to color, and then add that to the rendering loop.
Depending on whether the colors are static, or likely to change, you might want to consider not doing this in the main rendering loop, since the more you are doing the higher the potential impact on performance.
Alternatively, you could use a second canvas to draw the grid lines and colored squares once, and then only update and redraw that during transforms of the main canvas (i.e. don’t redraw the background canvas unless the canvas with the objects that are positioned on the grid is transformed (rotated, skewed, or scaled). For this to work, the foreground canvas would have to avoid drawing any background elements.
Hope that helps.
